Seismic sensors measure the ground acceleration
Fouriertransform.
Data Analysis of Seismic Measurements
Compilation of ground motion measurements
Data Analysis of Seismic Measurements

Figure 1 shows the principle layout of a velocity broadband seismometer. A feedback loop with a force transducer compensates the ground acceleration acting on the
seismic mass. The feedback current is proportional to the ground acceleration. The
voltage across the capacitor C is a time integral of the current, and thus proportional
to the ground velocity. This voltage serves as the output
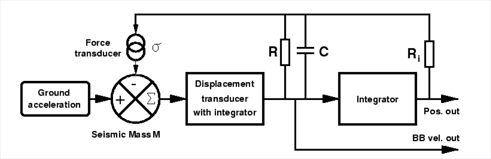
Figure 1 One channel of a velocity broadband seismometer feedback circuit1 signal.
The seismometer constant cs is the output voltage Ui per ground velocity dxi /dt.

Presently we are using only three channel sensors with a 24 bit digitizer (1.282 µV/bit)
without amplifier , 200 Hz sampling rate and a seismometer constant of 2 961 V/m/s.
Every minute the data of all three components are stored in a data file. The format of
the eight digit filename is mmddhhmm.prn (mm = month, dd = day, hh = hour and
mm = minute). Table 1 shows a sample file partly.
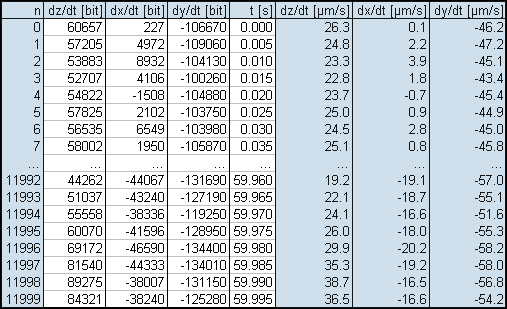
Table 1 Clipping of a data file (06161224.prn) with ground velocity data and calculated values (grey background).
The mean value

, the root mean square

and the root mean square in reference to the mean value

could be calculated directly from the raw data:
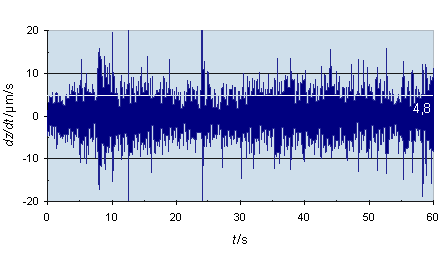
Figure 2 Vertical component of the ground velocity data shown in Table 1.
The root mean square in reference to the mean value for the shown data is 4.8 µm/s.


where dUn /dt is one of the three ground velocity components. The mean value has no meaning for the ground motion. For further analysis the data are transferred into the frequency space:
Discreet Fourier Transformation for a set of numbers
If n is an element of

and dUn/dt are n numbers then the discret Fourier
transformation is defined in general by

and the reverse transformation is given by

where

and

is. If dUn/dt are measured values (real numbers) then is

Figure 3.
Nyquists Theorem and Aliasing
The Niquist frequency fN is half of the sampling rate fS

All frequencies of digitally date above the Nyquist frequency fold over to lower
frequencies. This fold over is called aliasing.
Thus the Fourier Transformation for measured values is better described by the
following definition:
Discreet Fourier Transformation for a set of real numbers
If dUn/dt is a set of real numbers then the then the discreet Fourier transformation is defined by

with

and

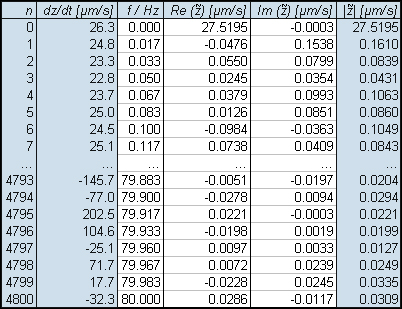
Table 2 Clipping of a data file (06161224.csv)
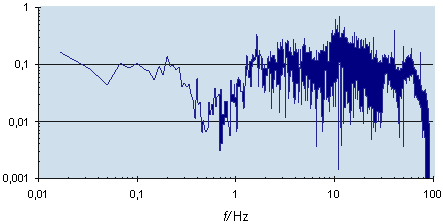
Figure 4 sv)
Fourier Transformed of the Motion
If the set of real numbers dUn/dt describes a one dimensional velocity then the Fourier Transformation of motion dUn/dt is given by

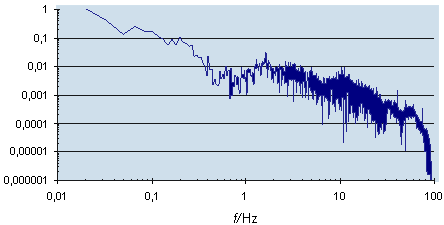
Figure 5 sv)
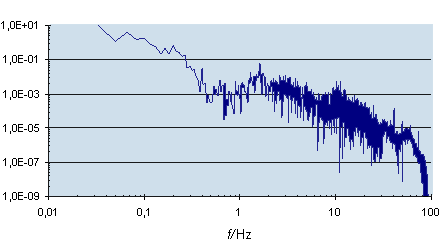
Figure 6 sv)
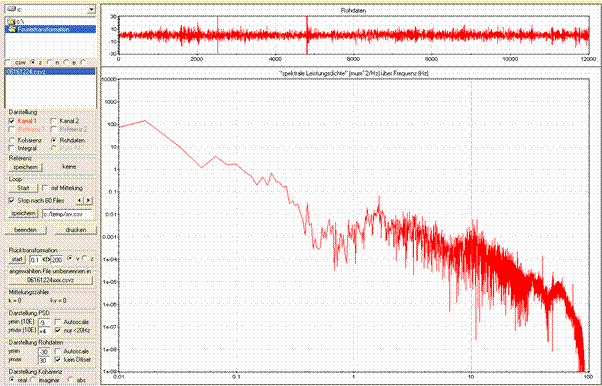
Figure 7.
Coherence
The rms of displacement,

above a cut-off frequency, normalized such that f = l/T, can be calculated from the power spectral density
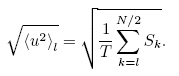
The PSD of displacement has a unit of μm²/Hz.
For better resolution of spectral details, the spectra are averaged over 15 minutes or even longer periods. Since “cultural noise” is dominant at f ≥ 1 Hz, the displacement PSDs measured were integrated in the range of 1 ≤ f ≤ 80 Hz, the upper limit matching the seismometer upper frequency response.
The spectrum of correlation Kk of two synchronized signals ũk and ˜zk, for any value k, estimated by averaging over many 1 minute measured data sets, is defined as
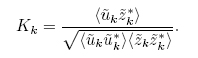
Kk is a complex number by definition and coherence between
two signals is hence defined as

By definition, coherence of two signals is between 0 and 1.